Intuit – A DEOPX Case Study
In the Davenport Equity Opportunities Fund (DEOPX), we rely on our deep research process to uncover quality businesses with strong balance sheets, run by capable management teams that can compound shareholder capital at high rates of return. Once a business is identified, we employ a strict valuation discipline to ensure we pay a “fair” price or better. While we are not perfect, the stars have aligned nicely in certain instances throughout the Fund’s history, allowing us to deliver attractive returns with less risk. Below, we highlight our experience with long standing holding, Intuit Inc. (INTU), which illustrates what happens when we get it right.
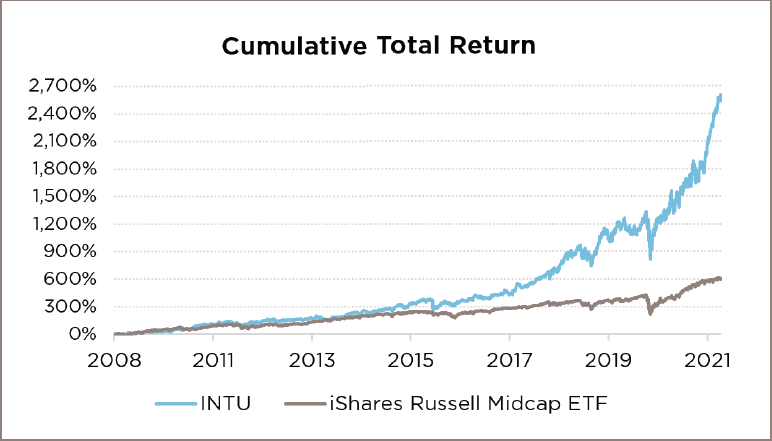
Intuit is a Mountain View, California-based software company that is famous for its TurboTax and QuickBooks applications. Prior to our recent sale, INTU was one of the most tenured holdings in DEOPX, and during our ownership the stock appreciated more than tenfold. We last added to it in 2013 with the stock in the mid-$50 range. At that time, the company had a market capitalization of $17 billion and traded for 15x forward earnings. Since then, the company has executed tremendously, reinvigorating growth in the consumer tax business, scaling its QuickBooks franchise, and transitioning its services to higher margin more recurring, cloud delivered revenue streams. As a result, revenues have grown at a 9.6% compound annual growth rate (CAGR) over the last 10 years, while Free Cash Flow (FCF) compounded at a 14.8% annual rate. All the while, management has augmented solid execution with effective capital allocation, using excess cash flow to return more than $15 billion via share repurchases and dividends over this period. Fast forward to the time of our sale, and the stock fetched $560 per share, with a market cap of $155 billion implying a forward price to earnings (P/E) multiple of nearly 50x.

Though we elected to take profits in Intuit due to what we believe to be a more balanced risk reward profile, we maintain a great degree of respect for the franchise. Furthermore, we feel great about the opportunity set for the roster of companies we currently own. We are constantly in search of the next great story and look forward to reporting back to you on what our process uncovers in the future.
DEOPX Trailing Performance (%) Net of fees
| Last Month End: 9/30/2021 | 1 Month | QTD | YTD | 1 Year | 3 Years* | 5 Years* | 10 Years* | Since Inception* |
| Davenport Equity Opportunities | -4.10 | 1.94 | 15.62 | 34.50 | 19.75 | 16.51 | 16.24 | 14.28 |
| Russell Mid Cap® | -4.12 | -0.93 | 15.17 | 38.11 | 14.22 | 14.39 | 15.52 | 12.98 |
An investor may obtain performance data current to the most recent month end by calling (800) 846-6666, or by visiting our website at www.investdavenport.com. Performance shown is historical and is no guarantee of future results. Current performance may be lower or higher than the data quoted. The investment return and principal value of an investment will fluctuate. An investor’s shares, when redeemed, may be worth more or less than their original cost. The Fund’s gross expense ratio is 0.89%.
Investors should consider the Fund’s investment objectives, risks, charges, and expenses carefully before investing. The Fund’s prospectus contains this and other important information, should be read carefully before investing or sending money, and may be obtained from your Investment Executive, www.investdavenport.com, or by calling (800) 846-6666.
Important Information:
As of September 30, 2021, the Fund owns 0% of Intuit.
Past performance is not indicative of future results. Diversification and asset allocation does not ensure a profit or guarantee protection against a loss. There is no guarantee that a company will continue to pay dividends. The statements and opinions expressed in this article are those of Davenport Asset Management as of the date of the article, are subject to rapid change as economic and market conditions dictate, and do not necessarily represent the views of Davenport & Company LLC. This article does not constitute investment advice, is not predictive of future performance, and should not be construed as an offer to sell or a solicitation to buy any security or make an offer where otherwise unlawful. Investing in securities carries risk including the possible loss of principal. Individual circumstances vary.
Source: FactSet as of 09/30/2021.
Davenport Funds are distributed by Ultimus Funds Solutions LLc, Member FINRA/SIPC. Davenport Funds and Ultimus Funds Solutions LLC, are non-affiliated companies. 13778867-UFD-10282021
Important Definitions: The Russell Midcap Index measures the performance of the 800 smallest companies in the Russell 1000®. London Stock Exchange Group PLC and its group undertakings (collectively, the “LSE Group”). © LSE Group 2021. FTSE Russell is a trading name of certain LSE Group companies. “Russell®” is a trade mark of the relevant LSE Group companies and is used by any other LSE Group company under license. All rights in the FTSE Russell indexes or data vest in relevant LSE Group company which owns the index or the data. Neither LSE Group nor its licensors accept any liability for any errors or omissions in the indexes or data and no party may rely on any indexes or data contained in this communication. No further distribution of data from LSE Group is permitted without the relevant LSE Group company’s express written consent. The LSE Group does not promote/sponsor/endorse the content of this communication.