Highlighting Small and Mid-Cap
August 2021
We wanted to take a moment to highlight the recent performance of both our Davenport Small Cap Focus Fund (DSCPX) and Davenport Equity Opportunities Fund (DEOPX). While long-term performance certainly matters more than one year, it’s still worth noting that both were lagging their benchmarks for much of 2021 as “risk on” became the pervasive mindset. However, both funds have recently surpassed their benchmarks on a year-to-date basis as we have seen more speculative corners of the market cool off a bit. The bounce back is particularly noticeable in DSCPX as we have seen better performance in a more volatile small cap tape. These bounces serve as a nice reminder that change happens quickly and quality matters.
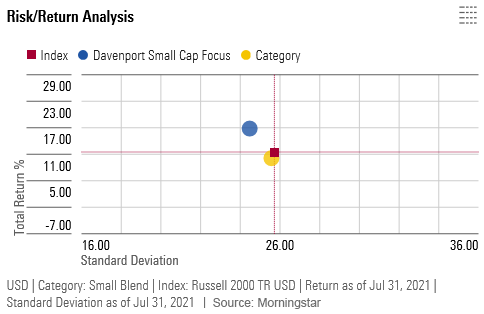
As of June 30, 2021, Davenport Small Cap Focus (DSCPX) was trailing it’s Russell 2000® Index benchmark by 9.72%. As of August 20th, DSCPX is up 2.95% for the month, up 3.30% for the quarter, and up 11.36% for the year versus the Russell 2000which is down 2.56% for the month, down 6.10% for the quarter, and up 10.39% for the year.
- Investment themes of Water and Insurance showing promise as water treatment provider, Evoqua Water Technologies (AQUA) & Insurance broker, BRP Group (BRP) have led the way
- Performance can be lumpy; however, DSCPX has shown to be a winner over the long term.
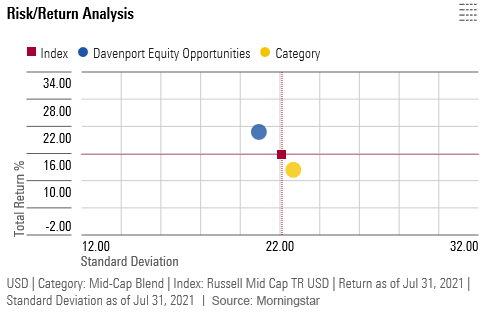
As of June 30, 2021, Davenport Equity Opportunities (DEOPX) was trailing it’s Russell Midcap® Index benchmark by 2.83%. As of August 20th, DEOPX is up 2.64% for the month, up 4.70% for the quarter, and up 18.72% for the year versus the Russell Midcap which is down 0.28% for the month, up 0.50% for the quarter, and up 16.81% for the year.
- Investment themes of Water and Connectivity are at work as water treatment provider, Evoqua Water Technologies (AQUA) and telecom tower operator, American Tower (AMT) performed well.
In both Funds, we’ve seen patience pay off with a number of holdings that temporarily under-performed as momentum was hot and investors were chasing various fads. DSCPX and DEOPX clients should be aware that in the short term, volatility is expected; however, disciplined investing in quality companies has led to excellent long term results. As always, thank you for your support and please reach out with any questions.
LEARN MORE ABOUT DSCPX | LEARN MORE ABOUT DEOPX
Securities and Advisory Services offered through Davenport & Company LLC Member: NYSE | FINRA | SIPC
You should consider each mutual fund’s investment objectives, risks, charges and expenses carefully before investing. Each mutual fund’s prospectus contains this and other important information, should be read carefully before investing or sending money, and can be obtained by contacting your Investment Executive, or by calling (888) 285-1863.
Important Disclosures
Past performance is not indicative of future results. Diversification and asset allocation does not ensure a profit or guarantee protection against a loss. There is no guarantee that a company will continue to pay dividends. The statements and opinions expressed in this article are those of Davenport Asset Management as of the date of the article, are subject to rapid change as economic and market conditions dictate, and do not necessarily represent the views of Davenport & Company LLC. This article does not constitute investment advice, is not predictive of future performance, and should not be construed as an offer to sell or a solicitation to buy any security or make an offer where otherwise unlawful. Investing in securities carries risk including the possible loss of principal. Individual circumstances vary.
Evoqua Water Technologies (AQUA) holds 2.05% of the security in DEOPX, and 3.02% in DSCPX. Insurance Broker, BRP Group (BRP) holds 0.00% of the security in DEOPX, and 1.77% in DSCPX. American Tower Corp (AMT) holds 2.55% of the security in DEOPX, and 0.00% in DSCPX.
Source: Morningstar Direct. ©2021 Morningstar, Inc. All rights reserved. The information contained herein: (1) is proprietary to Morningstar and/or its content providers; (2) may not be copied or distributed; and (3) is not warranted to be accurate, complete, or timely. Neither Morningstar nor its content providers are responsible for any damages or losses arising from any use of this information. DSCPX shown versus the Russell 2000 since 12/31/14. DEOPX shown versus the Russell Mid Cap since 12/31/10. Past performance is no guarantee of future results.
Trailing Performance (%) Net of Fees
| Last Quarter End: 06/30/2021 | 1 Month | QTD | YTD | 1 Year | 3 Year* | 5 Year* | Since Inception |
| Davenport Small Cap Focus Fund | -0.99 | 1.92 | 7.82 | 40.98 | 16.83 | 17.39 | 13.31 |
| Russell 2000® Index | 1.94 | 4.29 | 17.54 | 62.03 | 13.52 | 16.47 | 12.05 |
Trailing Performance (%) Net of Fees
| Last Quarter End: 06/30/2021 | 1 Month | QTD | YTD | 1 Year | 3 Year* | 5 Year* | 10 Years* | Since Inception |
| Davenport Equity Opportunities Fund | 1.77 | 7.08 | 13.41 | 44.13 | 20.93 | 17.20 | 14.13 | 14.44 |
| Russell Mid Cap® Index | 1.47 | 7.50 | 16.25 | 49.80 | 16.45 | 15.62 | 13.24 | 13.41 |
An investor may obtain performance data current to the most recent month end by calling (800) 846-6666, or by visiting our website at www.investdavenport.com. Performance shown is historical and is no guarantee of future results. Current performance may be lower or higher than the data quoted. The investment return and principal value of an investment will fluctuate. An investor’s shares, when redeemed, may be worth more or less than their original cost. DSCPX has an expense ratio of 0.93% and DEOPX has an expense ratio of 0.89%.
Index Definitions: The Russell 2000 Index measures the performance of the 2000 smallest companies in the Russell 3000® Index. The Russell Midcap Index measures the performance of the 800 smallest companies in the Russell 1000, which represent approximately 25% of the total market capitalization of the Russell 1000. London Stock Exchange Group PLC and its group undertakings (collectively, the “LSE Group”). © LSE Group 2021. FTSE Russell is a trading name of certain LSE Group companies. “Russell®” is a trade mark of the relevant LSE Group companies and is used by any other LSE Group company under license. All rights in the FTSE Russell indexes or data vest in relevant LSE Group company which owns the index or the data. Neither LSE Group nor its licensors accept any liability for any errors or omissions in the indexes or data and no party may rely on any indexes or data contained in this communication. No further distribution of data from LSE Group is permitted without the relevant LSE Group company’s express written consent. The LSE Group does not promote/sponsor/endorse the content of this communication. An investor cannot invest in an index, and its returns are not indicative of the performance of any specific investment. Risk: can be defined and measured in many different ways. Standard Deviation measures the variability of returns around the average return.
© 2021 Davenport & Company LLC – All Rights Reserved. The Davenport Funds are distributed by Ultimus Fund Distributors, LLC. (Member FINRA) The Davenport Funds and Ultimus Fund Distributors, LLC are separate and unaffiliated.
#13406998-UFD-08252021